ISA time: add more now…
Apr 26, 2013
As the tax year-end approaches, it is time to top up your ISA.
With February upon us, it won’t be long before the ISA supplements start appearing in the weekend papers. The end-of-tax-year rush to invest in an ISA is at once both sensible and illogical. It’s sensible because of the benefits an ISA offers:
- Dividends and income from fixed-interest securities are free of personal UK tax within a stocks and shares ISA, although dividend tax credits can’t be reclaimed.
- Interest earned on deposits is UK tax-free in a cash ISA. A flat 20% tax applies within a stocks and shares ISA.
- Gains made within ISAs are free of capital gains tax (CGT).
- ISA income and gains do not have to be reported on your tax return.
The illogic stems from the timing: why wait until the end of the tax year before taking advantage of the ISA’s tax benefits if you could have invested last April and enjoyed them since then? The answer is probably that there’s nothing like a deadline to concentrate minds, and, as a result, the marketing departments of financial services companies make the most of them.
In recent years, cash ISAs have attracted the bulk of ISA subscriptions, despite the base rate having been 0.5% since March 2009. The most successful cash ISA providers have relied upon temporary bonuses to attract investors – last year’s ISA season saw rates of around 3%, of which up to 2.5% was accounted for by a one-year bonus (now just about to end). So far in 2013, rates have been lower, with the big banks either staying their hand or deciding they don’t need the cash. Most returns on offer are now below the prevailing inflation rate.
The value of your investment can go down as well as up and you may not get back the full amount you invested. Past performance is not a reliable indicator of future performance. Investing in shares should be regarded as a long-term investment and should fit in with your overall attitude to risk and financial circumstances.
RPI survives
Apr 26, 2013
The Retail Prices Index (RPI) was given a stay of execution in January.
In recent years, the RPI has fallen out of favour. The Government – and the Treasury in particular – has preferred to use the Consumer Prices Index (CPI) for indexing tax allowances and benefits. There are two main reasons for the move away from the RPI towards the CPI:
- The way in which the two indices are calculated means that the RPI will usually produce a higher number. For example, over the last ten years to December 2012 the CPI averaged 2.6% a year while the RPI averaged 3.3% a year. For a Government anxious to maximise tax revenue and minimise expenditure, the choice is obvious.
- The method used to calculate the RPI is widely accepted as flawed, whereas the CPI follows international standards (under another label it is the EU yardstick for UK inflation).
Last October the Office for National Statistics (ONS) put forward a consultation paper with four options for dealing with the gap between the RPI and CPI. Three of these would have brought the two indices closer together by moving the RPI calculation nearer to the CPI basis. The fourth option – do nothing – was widely seen as a straw man that ran counter to the thrust of the ONS’s consultation.
It was therefore a big surprise when the ONS announced in early January that ‘no change’ was its recommendation, and that this had been accepted by the UK Statistics Authority. The decision to leave the RPI calculation untouched is good news if you have:
- index-linked savings certificates;
- index-linked government securities; or
- an RPI-linked pension.
All would have performed less well if the RPI had been engineered downwards. The losers include the Government, which might have saved up to £3 billion a year if RPI had been cut down, and private sector final salary pension schemes, whose liabilities did not fall as they had hoped.

HMRC offers an exit route
Apr 25, 2013
Under renewed criticism for its inefficiency, HMRC is turning up the heat on users of complex tax avoidance schemes.
Shortly before Christmas, HMRC announced that it was offering a ‘settlement opportunity’ to users of some of the more aggressive tax avoidance schemes, including certain film-based arrangements. HMRC plans to have contacted anyone eligible by the end of January, although it has not spelt out an end date by which an offer must be accepted. Ominously, HMRC says that, “Where people decline the settlement opportunity, we will increase the pace of our investigations and accelerate disputes into litigation.”
The move by HMRC is not an example of seasonal kindness – HMRC is under great pressure from the Government and Parliament. The National Audit Office recently revealed that HMRC had a backlog of 41,000 open avoidance cases involving individuals and smaller companies.
The vast majority of these resulted from marketed avoidance schemes and almost half of the cases were three or more years old. These statistics attracted considerable criticism from the House of Commons’ Public Accounts Committee. Its Chair, Margaret Hodge, described the HMRC case load as ‘eye-watering’ and expressed concern that “without a credible plan to resolve these cases and to stamp out future avoidance, the public will lose confidence in the tax system’s ability to collect even-handedly what is due from all individuals and companies.”
The Financial Services Authority does not regulate tax advice.

Income drawdown revisited
Apr 25, 2013
The Autumn Statement increase in drawdown limits is not the panacea some press comment has suggested.
Last year the personal finance pages of the national press regularly carried stories about how income drawdown reviews had left investors facing large cuts in their future income. The drops – some by as much as 50% – were the result of five factors.
- The April 2011 reduction in the limit from 120% to 100% of the notional annuity used to set the ceiling.
- A change in the mortality assumptions for the notional annuity, reflecting improved longevity.
- The decline in long term gilt yields, which are a key part of the annuity basis.
- Disappointing investment performance over the five years since the ceiling was last set.
- Too high a level of withdrawals – choosing the maximum was (and always will be) the highest risk option.
The Autumn Statement addressed only the first of these by announcing a reversion to the 120% ceiling, although from when the change takes effect remains unclear. It is no complete cure, as the example shows.
| A cut, nonetheless |
Jim started his income drawdown with a fund of £200,000 in January 2008 at the age of 60. The maximum drawdown rate for him then was 7.8%, based on an underlying gilt yield of 4.75%. Five years later, at his first review, the gilt yield had fallen to 2.25% and, despite being five years older, his maximum drawdown rate had fallen to 5.5%. Even if the Autumn Statement reversal had taken effect, Jim would still have a maximum rate of 6.6%. If Jim had been taking withdrawals at say, £1,200 a month (7.2% of his initial £200,000), then to maintain his income now his fund would need to have grown – after £60,000 of withdrawals – to about £262,000. The Autumn Statement change would still require a fund of just over £218,000 – a tall order given the performance of most investment markets since 2008. |

The year end starts here
Apr 25, 2013
We may just have started 2013, but one aspect of tax year end planning is already well underway.
Venture capital trusts (VCTs) have three important tax benefits.
- Investment in newly issued shares will normally qualify for income tax relief at 30%.
- Dividends paid by VCTs are generally free of personal tax (although dividend tax credits cannot be reclaimed).
- Capital gains, both within VCTs and realised by investors, are generally free of UK tax.
Such tax generosity is not given lightly: VCTs are high-risk investments, focused on small unlisted companies. They may not suit your investment risk profile and, even if they do, VCTs should form only a small part of your overall portfolio.
Around the turn of the calendar year, the first crop of VCT offerings starts to appear. The VCT promoters all want to be at the front of the queue, so that they are not left scrabbling for investors’ funds in late March. One of the most successful VCT managers had three of its five trusts on offer fully subscribed before Christmas.
Many of the issues now on offer, or due to arrive soon, are top-ups to existing trusts. This can mean that you buy in to a ready-made portfolio, depending upon the structure of the offering. It also helps to avoid the risk of choosing a new VCT that has limited success in raising funds and either returns your money just as the tax year ends, or starts life with disproportionately high fixed costs.
In 2011/12, 76 VCTs sought to raise funds according to HMRC, a number that has changed little in recent years. Picking the wheat from the chaff among all the prospectuses is no easy matter. If you think VCTs might suit you, taking advice should be your starting point.
The value of your investment can go down as well as up and you may not get back the full amount you invested. Past performance is not a reliable indicator of future performance. Investing in shares should be regarded as a long-term investment and should fit in with your overall attitude to risk and financial circumstances. The value of tax reliefs depends on your individual circumstances. Tax laws can change. The Financial Services Authority does not regulate tax advice.
And another good year for bonds
Apr 25, 2013
2012 was another good year for fixed-interest investors.
The prolonged squeeze on interest rates helped 2012 to be another good year if you held corporate bond fixed-interest funds, although government bond funds were virtually flat. The performance for the main Investment Management Association (IMA) Sterling bond fund sectors is shown in the graph.
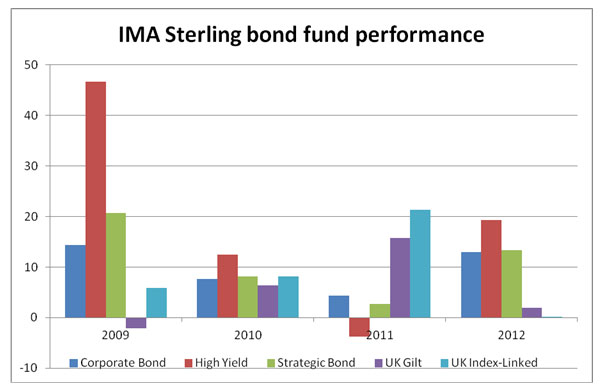
Source: FE Trustnet. Discrete performance for each calendar year to 31 December, bid-bid, net income reinvested.
Government bonds out-performed corporate bonds in 2011, but last year the situation reversed. Gilts, both traditional and index-linked, ran out of steam as buying by the Bank of England under its quantitative easing programme came to an end. Meanwhile corporate bonds benefitted from higher yields than gilts, although the volume of income-seekers buying meant that yield advantage narrowed over 2012.
What will happen to fixed-interest securities in 2013 is the subject of some debate. On the one hand, there is a feeling that from current levels, bond prices do not have much scope to rise, but they do have a long way they could fall, particularly if the UK economy starts to revive. On the other hand, there is the view that naysayers were proved wrong last year and that with the economy flat on its back as austerity grinds on, bonds remain a relatively attractive investment.
The value of your investment can go down as well as up and you may not get back the full amount you invested. Past performance is not a reliable indicator of future performance.

Not a bad year for equity markets…
Apr 8, 2013
Never mind the Eurozone crisis, UK double dip recession or the fiscal cliff – equity markets generally did well in 2012.
| Index | 2012 Change |
| FTSE 100 | + 5.8 |
| FTSE All-Share | + 8.2 |
| Dow Jones Industrial | + 7.3 |
| Standard & Poor’s 500 | +13.4 |
| Nikkei 225 | +22.9 |
| Euro Stoxx 50 | +13.8 |
| Hang Seng | +22.9 |
| FTSE All-Emerging All-Cap ($) | +14.9 |
The apparently modest performance of the UK in 2012 stems from several factors.
- It was not a good year for the commodity-based multinationals, which form an increasingly significant part of the UK stock market. The oil and gas sector fell by 11.2% over 2012, while the basic materials sector registered a rise of just 1.9%.
- The more UK-centric businesses did much better; witness the performance of the FTSE 250, which measures the 250 companies below the top 100 – about 15% of the UK stock market. The FTSE 250 gained 22.5% in 2012, which explains why the broader FTSE All-Share Index out-performed the more widely quoted FTSE 100.
- On top of the index capital return, there was a useful flow of dividends. The market ended the year with an average dividend yield of around 3.6%. The UK remains one of the highest yielding of the major global stock markets.
- The value of sterling rose against most currencies over the year. For example, it was up 4.6% against the dollar, 3% against the Euro and 17.5% against the Yen. Adjust for this and the UK stock market’s relative performance looks much better.
The value of your investment can go down as well as up and you may not get back the full amount you invested. Past performance is not a reliable indicator of future performance. Investing in shares should be regarded as a long-term investment and should fit in with your overall attitude to risk and financial circumstances.