Pension Trends
Jul 5, 2013
Just how much dearer has a retirement income become?
The Office for National Statistics (ONS) produces a series of pension data, called Pension Trends, which it divides into 14 regularly updated chapters. In April, the ONS issued an update for Chapter 10, ‘Saving for Retirement.’ This contained a table on annuity costs that produced a few attention grabbing headlines in the press. The table showed the cost of producing a specific level of inflation-linked income now and December 2009 for someone aged 65.
Annual income | £5,000 | £10,000 | £15,000 | £20,000 | £25,000 |
Man in 2009 | £118,000 | £236,100 | £354,100 | £472,100 | £590,200 |
Woman in 2009 | £133,500 | £267,100 | £400,600 | £534,200 | £667,700 |
Man or woman in 2013 | £152,800 | £305,600 | £458,300 | £611,100 | £763,900 |
Men have seen a 29% jump in annuity costs, while for women the increase is about half as much. The increase is down to three main factors.
1. There has been a fall in real yields on index-linked securities, which underpin inflation-linked annuities.
2. The mortality of pensioners has continued to improve. The 65 year-old of 2013 will generally live longer than the 65 year-old of 2009.
3. Unisex rates were introduced in December 2012 for annuities as the result of a European Court ruling. Rates for men consequently fell, while rates for women rose slightly – hence the difference in overall increased cost.
The ONS also published data on the wealth (excluding the main residence) of those close to retirement. These numbers are rather out of date (2008/10) and need to be treated with caution because of the way in which wealth is spread. For those aged between 50 and 64, the ONS says median (mid-point) net household savings were £195,600, of which £135,200 was in private pension savings. The average figures were much higher – £440,700 and £348,000 respectively – because of the concentration of wealth in the top 10% of households.
Wealth measured in hundreds of thousands looks impressive, but when you apply those annuity costs, it becomes only a modest income.
Volatile Return
Jun 21, 2013
The value of investments can go down as well as up…
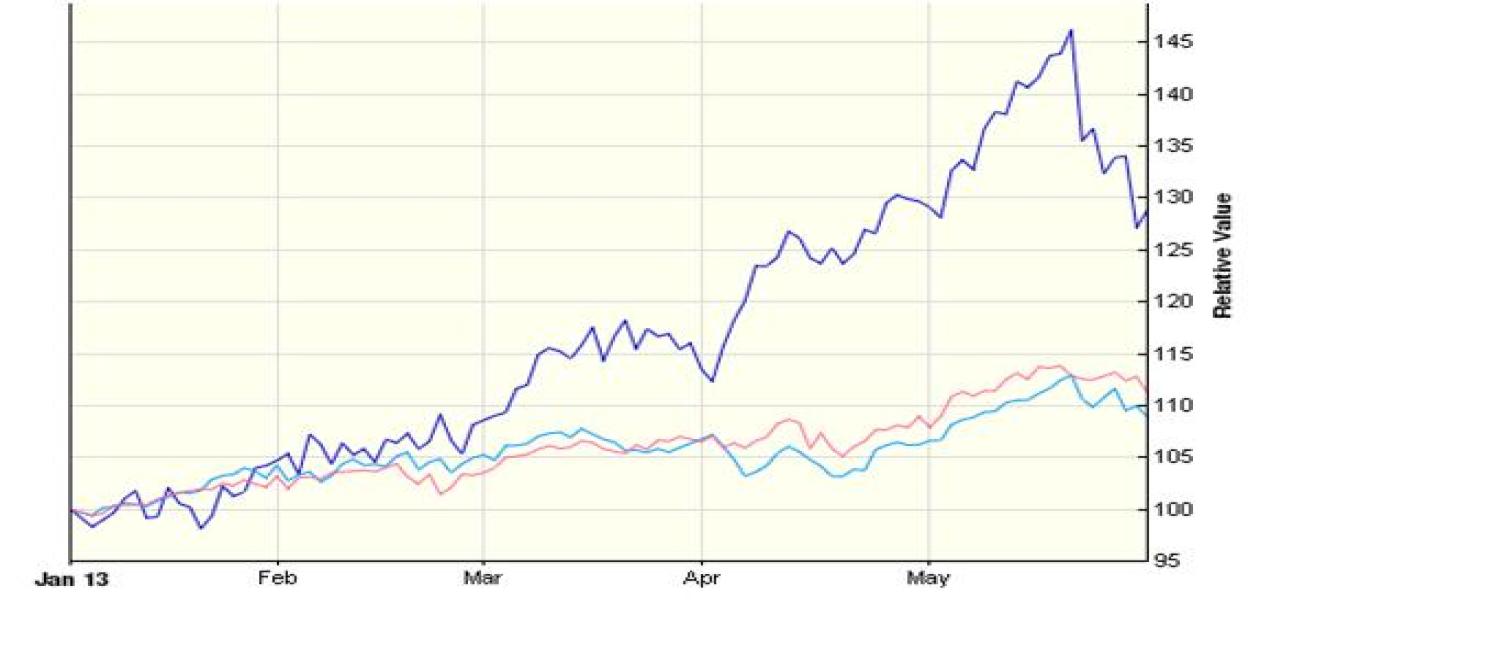
The second half of May saw a sudden bout of jitters hit global stock markets. As the graph shows, until mid-May the major markets had been enjoying a good 2013, with last year’s various concerns (Eurozone, US fiscal cliff, UK deficits, etc) seemingly forgotten.
Then, on 23 May, Japan’s Nikkei 225 plummeted by 7.3%, its biggest one-day fall since the March 2011 earthquake and tsunami. Other markets duly crumbled in Tokyo’s wake, although not to the same extent. The blame for the fallout was mostly pinned on one or both of the following:
- The previous evening Ben Bernanke, chairman of the US Federal Reserve, had raised the possibility that the process of quantitative easing (QE – ‘printing money’) could be phased down in coming months. QE has been seen by many as one of the reasons behind the global rally in share prices – all that extra money has to go somewhere.
- The China Manufacturing Purchasing Managers’ Index, released early on 23 May, hit a seven-month low. The reading was 49.6 – any figure below 50 implies a contraction. China has been the global growth story, so signs that it may be slowing are a worry for investors.
Whether either was the true cause, nobody knows: there is always a temptation to pin events to market movements rather than leave them unexplained. In the final week of May – shortened by a Monday holiday in some countries – markets remained volatile. It could all be just ‘noise’. Looked at over the month as a whole, the main US, UK and Japanese indices were virtually unchanged.
The first five months in the markets

Source: Digital Look
Dark blue: Nikkei 225
Red: S&P 500
Pale blue: FTSE All-Share
The value of your investment can go down as well as up and you may not get back the full amount you invested. Past performance is not a reliable indicator of future performance. Investing in shares should be regarded as a long-term investment and should fit in with your overall attitude to risk and financial circumstances.
Is this you?
Apr 26, 2013
A survey has highlighted the UK’s reluctance to save for retirement.
One of the major clearing banks recently undertook a retirement planning survey across 15 countries in which it operates. Among its findings for the UK were:
- One third of people were not making any preparation for retirement, while a virtually identical proportion thought they were not doing enough.
- The average expected time spent in retirement was 19 years, which was 12 years longer than the average time retirement savings were expected to last.
- In terms of retirement income, the average amount thought appropriate was 73% of pre-retirement income.
- Just 38% of people are regular savers, leaving the UK only above Egypt in terms of thrift.
- The UK came top in one unfortunate category: prioritising saving for a holiday over saving for retirement. Given the choice of only one savings goal for the year, 58% of the UK respondents chose a holiday, while 32% opted for retirement.
One interesting point the survey threw up was that, for those on average incomes, there was a strong relationship between financial planning and greater saving. People who had carried out some type of financial planning had at least four times the retirement savings of those who had failed to plan. Where professional advice is used, savings were two and a half times more than those of people who have not taken expert advice.
Long-term care costs
Apr 26, 2013
The Government has announced its proposals for funding long-term care.
Long-term care has been one of the topics which successive governments have pushed down the road with the help of enquiries, reviews and even a Royal Commission. The problem has always been the same: how to meet the cost for those who are not already funded by the state.
The Government has now published a policy statement, following up on a summer 2011 report it commissioned from a team headed by Andrew Dilnot. The framework – which is for England only – is far from generous. The headline-grabber is that there will be a cap on care costs to be met by an individual of £75,000 (index-linked). Alas, this is not as simple as it seems.
- Care means just that – the so-called ‘hotel costs’ of accommodation and food will still have to be met personally, which the Government says will be around £12,000 a year in 2017/18, when the new regime is due to start.
- The care cost that will be met is what a local authority would pay, based on an individual needs assessment. If you want better care/comfort than the local authority would buy, you will have to pay the excess and this will not count towards the £75,000 cap.
- The means test ceiling, above which there is no initial state help, will rise from the current £23,250 to £123,000. The floor, at which all costs are met, will increase from £14,250 to £17,000. The jump in the ceiling means that many more people will receive some help with care costs, but there has been no change to the basis of contribution – £1 a week for each £250 above the lower threshold (equivalent to 20.8%). So, for example, if you have assets worth £100,000, initially you would be expected to pay £332 a week towards your care.
The Government estimates the yearly cost in 2020 at £1 billion, which it says will be funded by the savings from state pension reforms and extending the freeze on the inheritance tax nil rate band at £325,000 until 2018. So, even if you think you can now dispense with planning for long-term care, you may want to revisit your estate planning.
Sterling slither
Apr 26, 2013
The pound has taken a beating since the start of the year.
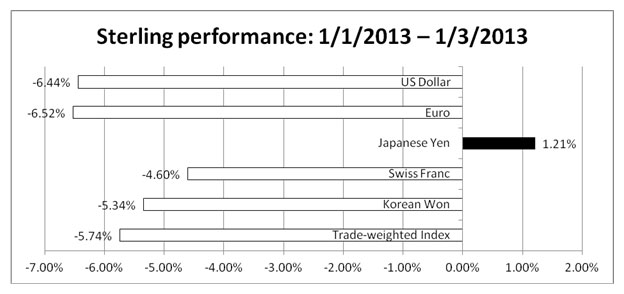
The graph says it all: the pound has had a grim two months against most major currencies. It has risen against the Japanese Yen only because the new Japanese prime minister has imposed a 2% target rate of inflation on the Bank of Japan. There are several possible reasons for the drop in the value of sterling:
The immediate concerns about a US fiscal cliff and a Eurozone collapse have receded, at least for the time being.
The disappearance of the UK’s triple-A rating. This had been expected for some time, although most experts thought the ratings agencies would wait for the Budget on 20 March before acting.
The UK’s austerity programme is viewed by some as failing to deliver on either deficit reduction or economic growth.
An expectation that the new governor of the Bank of England, who is due to arrive in July, will be more willing to see sterling weaken.
The new uncertainty about the UK’s continued membership of the EU.
The flipside of sterling’s demise is that the good performance most global stock markets have put in since the turn of the year has been magnified by the pound’s depreciation – with the exception of Japan. It is a useful reminder of the benefits of making sure your investments are internationally diversified.
Past performance is not a reliable indicator of future performance. The value of investments and income from them can go down as well as up and you may not get back the original amount invested. Investing in shares should be regarded as a long-term investment and should fit in with your overall attitude to risk and financial circumstances.
Of ever-dwindling interest
Apr 26, 2013
Instant access rates are shrinking further.
What do you think is the current top market interest rate for £10,000 in a new instant access account?
If you have not looked at the savings league tables recently, it may surprise you to learn that the answer is now just 2%. And that is gross, so if you are a 40% taxpayer, the net return is just 1.2%, little more than a third the current rate of retail prices index (RPI) inflation.
Rates have fallen for new accounts and for many existing variable rate accounts (notably the Post Office) because the banks and building societies can access up to £80 billion worth of cheap money under the Funding for Lending Scheme (FLS). The FLS was launched by the Treasury and Bank of England last summer in an effort to stimulate lending to households and businesses. So far, the main impact has been on deposit rates for investors and the mortgage market, where rates for new loans have been falling.
The drop in instant access deposit rates has rippled through to fixed term accounts, with only the longest terms from a handful of lenders now offering a rate above 3%. This year’s cash ISA season looks set to be much less competitive than previous years, with building societies rather than banks giving the best terms at the time of writing.
We all need some rainy day money on deposit – three to six months’ cover for outgoings is a good start – but if you have more, now is a sensible time to consider ways in which you could make that excess cash work harder, if only to counter that stubbornly over-target inflation rate.
Past performance is not a reliable indicator of future performance. The value of investments and income from them can go down as well as up and you may not get back the original amount invested.
The Bank of England changes its inflation stance
Apr 26, 2013
The latest Bank of England Inflation Report shows the Old Lady resigning herself to more inflation.
In recent years the Bank of England (BoE) has gained an unfortunate reputation for over-optimism about the path of inflation. The BoE’s Quarterly Inflation Reports (QIRs) have regularly said that inflation would be back on target (2% of the consumer prices index [CPI]) by the end of its two-year forecast period. Each quarter’s bulletin has contained a graph which, almost magically, showed the chances of inflation being above target were 50% two years out. However, CPI inflation has been over 2% since December 2009 and has only been below 2% for six months in the last five years, and reached a peak of 5.2% as recently as September 2011.
The BoE’s latest QIR, the penultimate of Sir Mervyn King’s tenure as Governor, has changed tack somewhat. The February edition says that ‘Inflation has remained stubbornly above the 2% target…CPI inflation is likely to rise further in the near term and may remain above the 2% target for the next two years.’ The graph now shows a near 60% probability that inflation will be over 2% in the first quarter of 2015, with the 50% level not being reached for another year.
The BoE’s new inflation sangfroid is a reflection of the state of the economy and government finances.
- In normal times, above-target inflation would mean that the BoE would increase interest rates. However, the parlous state of the UK economy rules out such a course of action. Rate rises and the threat of a triple-dip recession are not compatible.
- Some of the inflationary pressure is the result of Government policy, which the BoE is powerless to counter. The QIR comments that moves such as increases to tuition fees and green levies on energy suppliers added around 1% to inflation at the end of 2012, and are likely to continue to add to it.
The message of the BoE’s new stance is that, at least for now, inflation is less of a concern than helping the economy by keeping interest rates low and taking other monetary action, such as quantitative easing. That is not good news if you hold large sums on deposit.
Personal allowances: the winners and losers
Apr 26, 2013
Personal allowances will be based upon a person’s date of birth rather than their age as of the 2013/14 tax year, with allowances for older people frozen at their 2012/13 levels.
People born between 6 April 1938 and 5 April 1948 will receive a higher allowance, with those born before 6 April 1938 receiving slightly more. So people reaching the age of 65 or 75 during 2013/14 will not see any increase to their personal allowance.
So who are the winners and losers? The clear winners are younger basic rate taxpayers who will see their personal allowance increase by £1,335 – a tax benefit of £267. But for higher rate taxpayers the benefit is just £62. People who qualify for the higher personal allowance will not see any difference because the allowance is frozen, although the income level at which the additional element is withdrawn has gone up by £700 to £26,100.
The most aggrieved will be those turning 65 during 2013/14. Instead of receiving the higher allowance of £10,500, they will continue to receive just the normal personal allowance of £9,440. The same is true for anyone reaching 75 next year but they will only lose the modest increase from £10,500 to £10,660.
State pension reform
Apr 26, 2013
The much-delayed White Paper on the future of state pensions has been published.
When the Government issued a Green Paper on state pension reform last April, the expectation was that a White Paper would follow in the summer…then autumn…then before Christmas. It eventually arrived, suitably snow covered, in January – along with a complete Pensions Bill following close behind.
While many of the finer points are yet to be settled, the framework for the new state pension regime is now clear.
- The current two-tier state pension system, comprising of the basic state pension (BSP) and earnings-related state second pension (S2P) will be replaced by a single-tier, flat-rate pension. The White Paper assumes ‘for illustrative purposes’ that this would be £144 a week in today’s earnings terms, against a current BSP of £107.45 a week.
- You will need National Insurance (NI) contributions or credits covering 35 years to obtain the full £144 a week – five more than are needed for the current BSP. If your NI record is less a minimum period (likely to be ten years), you will receive no state pension. At present you earn BSP for each year, regardless of how few.
- The single-tier pension will be earned on an individual basis, so you will not be able to rely on the NI record of your spouse or civil partner to boost your flat-rate state pension. However, transitional provisions will apply to soften the blow.
- The new pension will rise in line with earnings once in payment. The ‘triple lock’ guarantee which applies to the BSP (the greater of price inflation, earnings growth and 2.5%) is not guaranteed to continue beyond 2015.
- The state pension age (SPA) for men and women will rise to 67, with a two-year phase-in starting in April 2026. The Pensions Bill also imposes a requirement for five-yearly reviews of SPA, with the first due by May 2017. Any change decided at review will not take effect for at least ten years.
- You will not receive any savings credit if you reach SPA once the new flat rate pension is in place. Guarantee credit will still be available, but if you receive the full flat rate pension, you will not be eligible.
- At the point when the new regime is introduced, the existing state benefits you have accrued will be converted to a ‘foundation pension’. The calculation of this is designed to ensure that what you have earned to date is not lost, but how contracted out benefits are dealt with remains unclear. If your foundation pension exceeds the new flat rate pension, then the excess will be CPI-inflation proofed before and after retirement.
- The ending of S2P will mean that if you are currently contracted out through a final salary scheme, your (and your employer’s) NI contributions will increase. Ironically it will be the Government, as public sector employer, that will be most affected.
- The new regime will begin in April 2017, at the earliest.
All these changes will not mean the Government spends any more on pensions. The White Paper’s analysis shows that, in the long run, the Government will save money, even before taking account of the extra income from the ending of NI contracting out rebates. The corollary is that, just as the present state pension system will not provide a decent standard of living in retirement, neither will the single-tier system. But it will be simpler…
ISA time: and add still more in the future...?
Apr 26, 2013
There may be an increase in ISA limits on the way.
Last month, the Office of Tax Simplification (OTS) published its final report on simplifying the tax system for pensioners. The OTS made some useful suggestions, such as saying that the Department for Work and Pensions should issue a consolidated statement of taxable benefits each year, similar to a P60. It also proposed that HMRC produces a composite notice of coding for people (probably the majority) who have pensions paid from a variety of sources. Whether either cash-strapped arm of government would make the necessary system changes is a moot point – so much so, that the OTS stressed that its proposals should be considered as a whole, and not cherry-picked.
The OTS comment has more weight when one of its policy changes is considered: the abolition of the 10% savings rate band. This would affect not just pensioners, but anyone with a low level of earned income and a high level of interest income (which could mean wealthy, non-working spouses). In practice, ‘the levels of confusion and the low level of take up’ mean that the 10% band is widely ignored. You have to claim the tax refund resulting from the 10% rate with a self-assessment return or HMRC form R40 (which cannot be completed online).
The OTS recommends that, with the 10% band scrapped, the ‘money saved [about £50 million a year] could be used to make a pragmatic above-inflation increase in the ISA limit.’ It will be interesting to see whether the Chancellor takes up the OTS’s suggestions when he presents the Budget on 20 March 2013. The politics are particularly tempting for Mr Osborne, given that the 10% savings rate band is a hangover from Gordon Brown’s era as Chancellor. In his last Budget, in 2007, Mr Brown announced that the 10% band (which he’d introduced in 1999) would no longer apply to all income from 2008/09. That left his successor, Alistair Darling, with a backbench rebellion to deal with the following year.
The value of your investment can go down as well as up and you may not get back the full amount you invested. Past performance is not a reliable indicator of future performance. Investing in shares should be regarded as a long-term investment and should fit in with your overall attitude to risk and financial circumstances. The value of tax reliefs depends on your individual circumstances. Tax laws can change. The Financial Services Authority does not regulate tax advice.